Alan Hamlett
Happy New Year!

In 2022, more than 400k developers spent a combined 43 million hours programming, tracked with WakaTime plugins. The average person spent 46 minutes per day programming.
Each year we release a personalized coding report showing your accomplishments over the last year. We also include average trends for all WakaTime devs showing the most used languages, IDEs, and operating systems. These trends come from aggregating the WakaTime personal dashboard metrics when a developer installs one of our IDE plugins. But first, a quick list of new features released in 2022.
New Features & Milestones
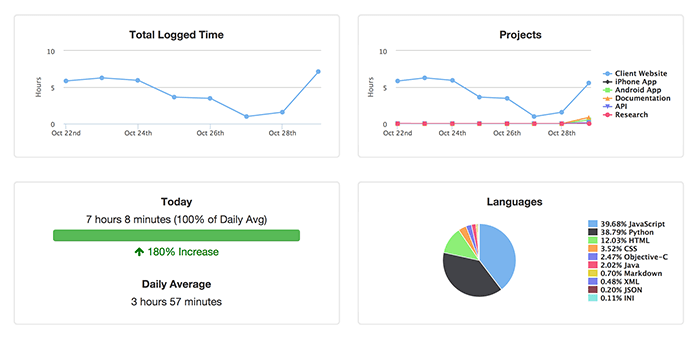
📊 Insights dashboard
We built a whole new dashboard for all your code insights. See which weekday you code the most over the last year, your daily average code time, and more cool insights about the time you spend coding.
👩🏼💻 GitHub-style activity table
Add a GitHub-style activity chart to your public profile, showing the frequency of your code time over the last year.
😎 Custom project colors
Set custom colors for your projects. All HEX color codes are supported, except for the reserved colors black and white. That’s over 16 million custom colors for your projects!
⚖️ Segment your code time
See your time spent coding vs. attending meetings, or the time you spent coding at home vs. work.
Programming stats for 2022
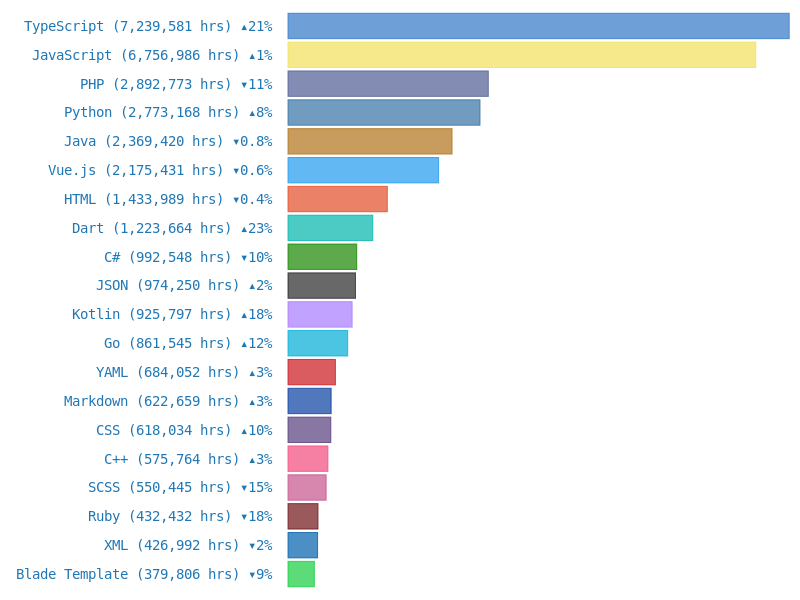
Top languages for 2022
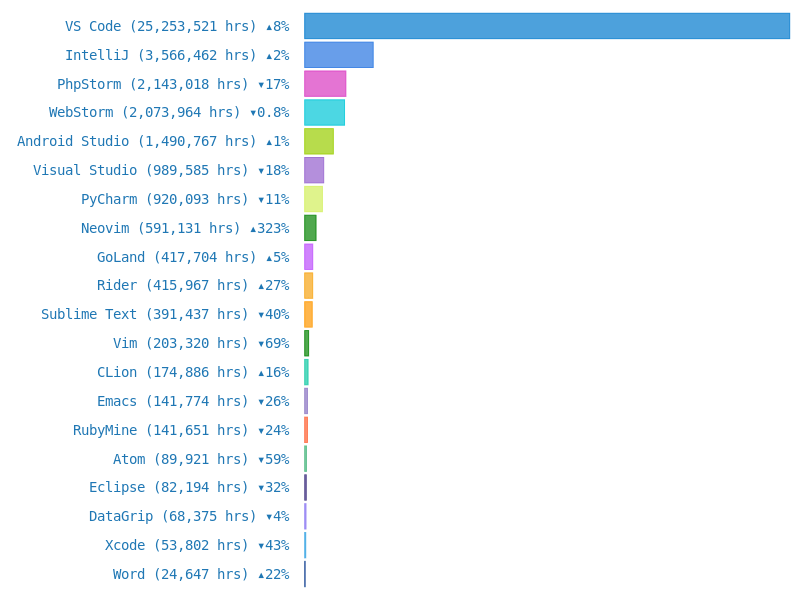
Top editors for 2022
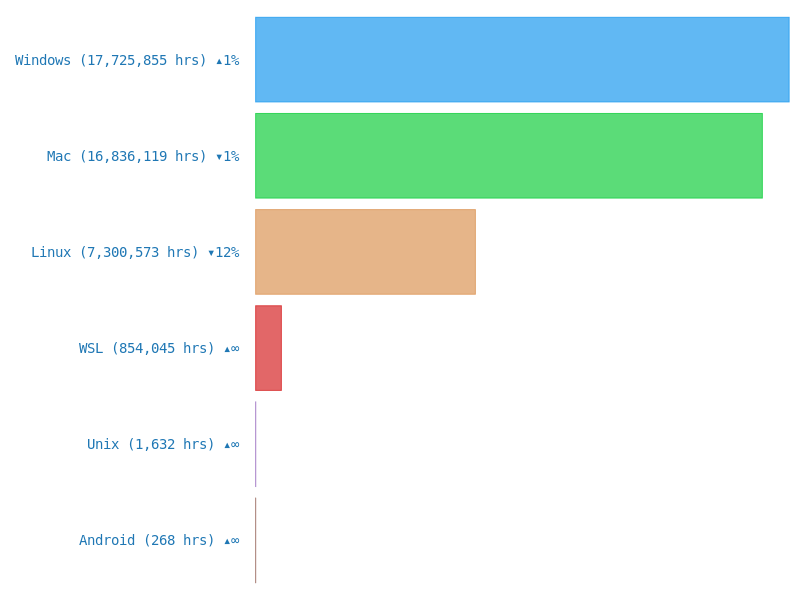
Top operating systems used
See your personalized report for 2022 here:
View your personalized 2022 stats
These aggregated 2022 stats are available as JSON, and also available for previous years.