Alan Hamlett
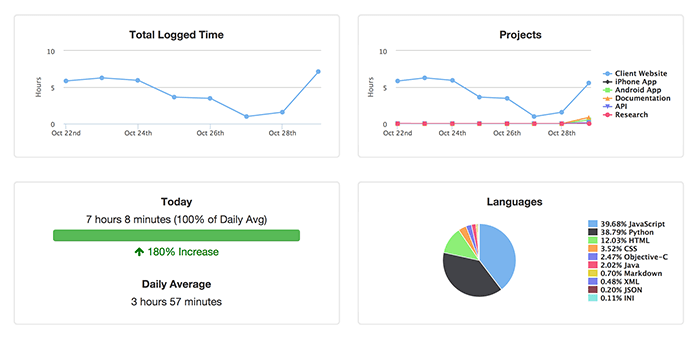
Today we bring you a new dashboard feature:
Segmenting your code stats.
See the time of day you were coding, compiling, or in meetings. Click the settings icon to choose how to segment your code stats. For example, see your time segmented by:
Category (Compiling vs. Coding vs. Meetings)
Language
Editor
Operating System
Machine (Work vs. Home)
This is just one way we’re working to visualize your productivity and bring you insights about your coding. You can find this chart on your personal dashboard. If you have a suggestion, feedback, or just want to chat, please do send us an email. We would love to hear from you!
To download your data for offline analysis, export your code stats from your settings page or using our open API.