Alan Hamlett
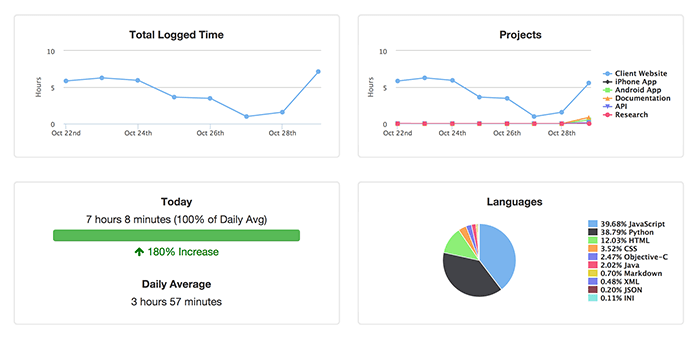
WakaTime is like fitbit for programmers, and we are always looking for new ways to visualize our data. Our dashboard is great for seeing project, file, and branch level visualizations over various time ranges, but it can't create custom queries of your data. You could use our api, but we have an easier way...
Introducing wakadump!
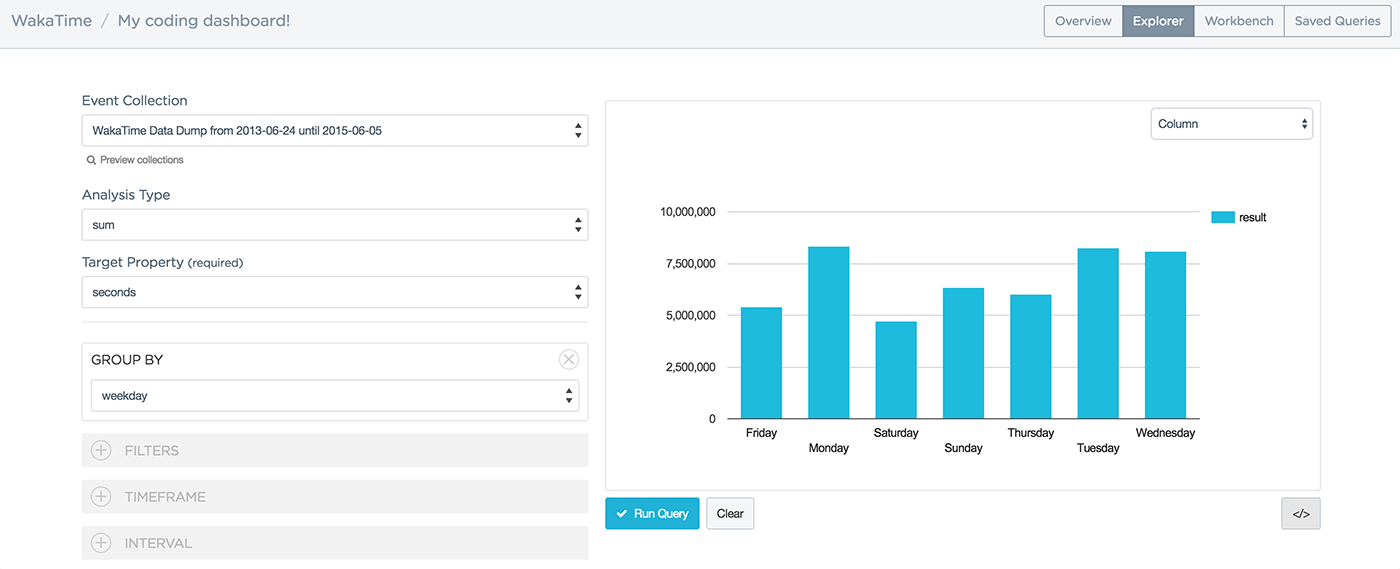
Using wakadump, you can easily export your WakaTime data to Keen IO and take advantage of their powerful data explorer features. For example, I queried all my WakaTime data from the last year and was quickly able to create these custom visualizations:
Most productive day of the week
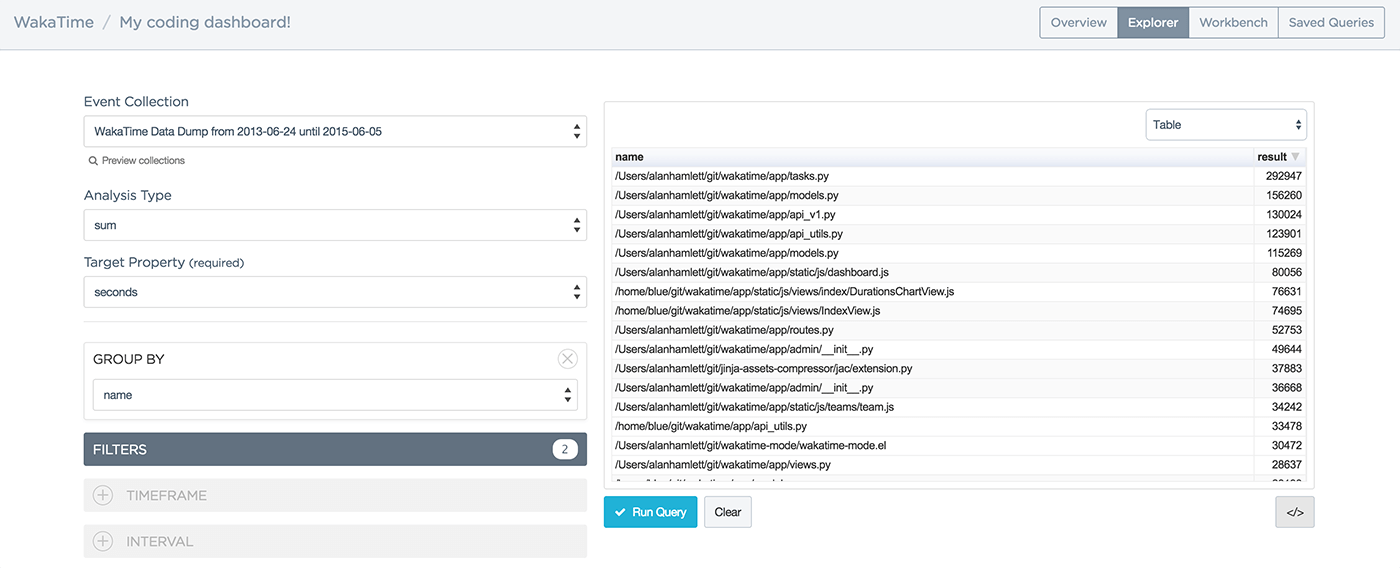
Top files worked in over the last year
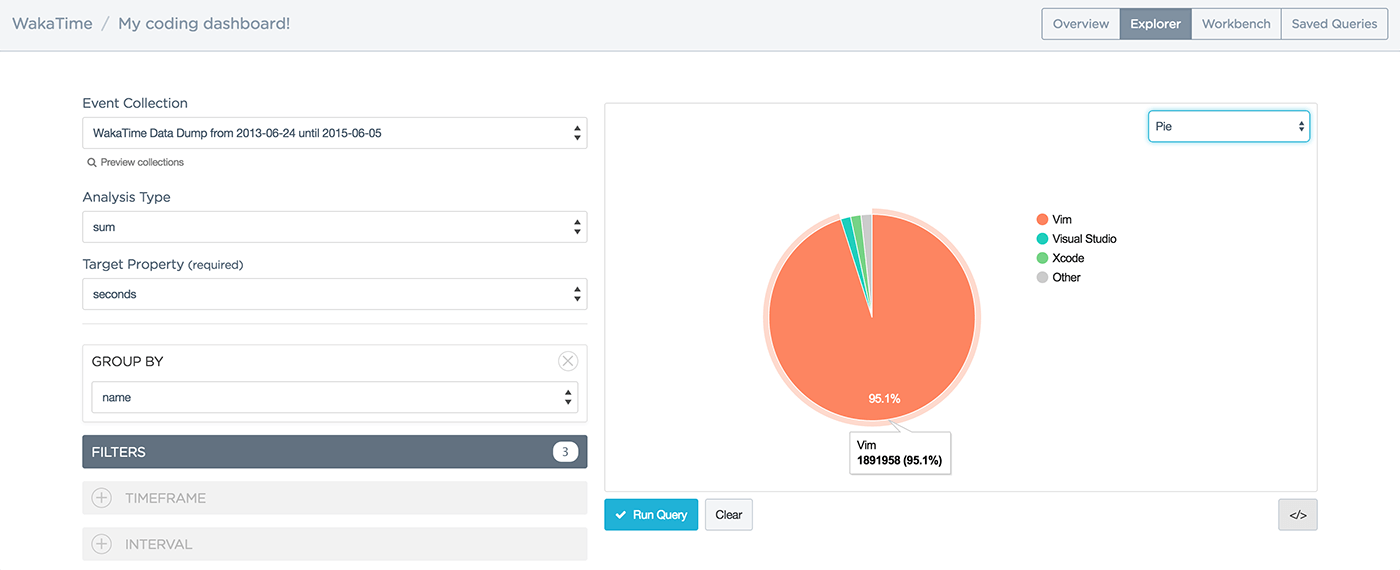
Editor usage over the last year
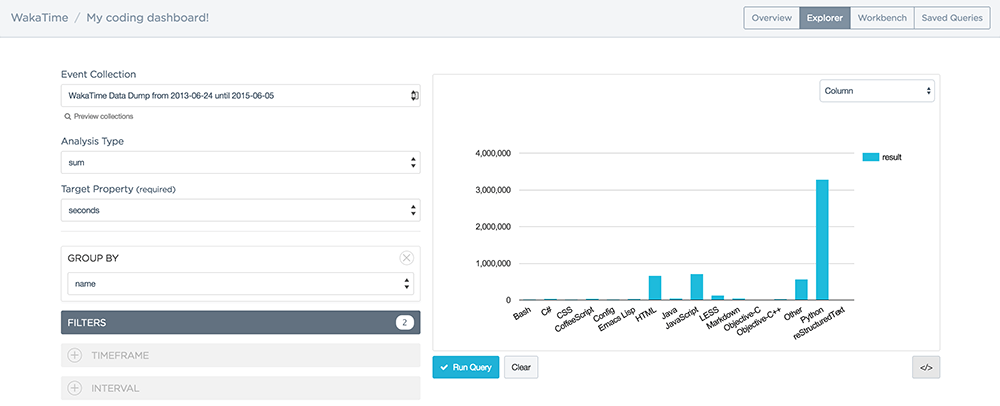
Programming languages used over the last year
Create your own visualizations
To create your own custom queries using the Keen IO data explorer, just follow these steps:
Install wakadump with:
sudo pip install wakadumpExport your logged time from your settings page.
Sign up for a free Keen IO account and grab your
Project IDandWrite Keyfrom your project page.Upload your WakaTime data to Keen IO by running this command:
wakadump --input wakatime-user.json --output keen.io
keen.io Project ID: XXXX
keen.io project Write Key: XXXX
Preparing keen.io events...
Uploading events to keen.io...
Complete.
Create custom queries using Keen IO's Data Explorer
If you find something interesting from your WakaTime data, please do share your insight in the comments or send me an email!