Alan Hamlett
The newest chart on the WakaTime Dashboard shows the time you were coding with detailed accuracy. With this chart you can interactively visualize your day’s coding activity at different levels of granularity. We all spend time outside our editors doing things other than programming such as hosting meetings, talking to customers, etc. This chart let’s you fill in the gaps by counting those hours where you were doing non-coding tasks.
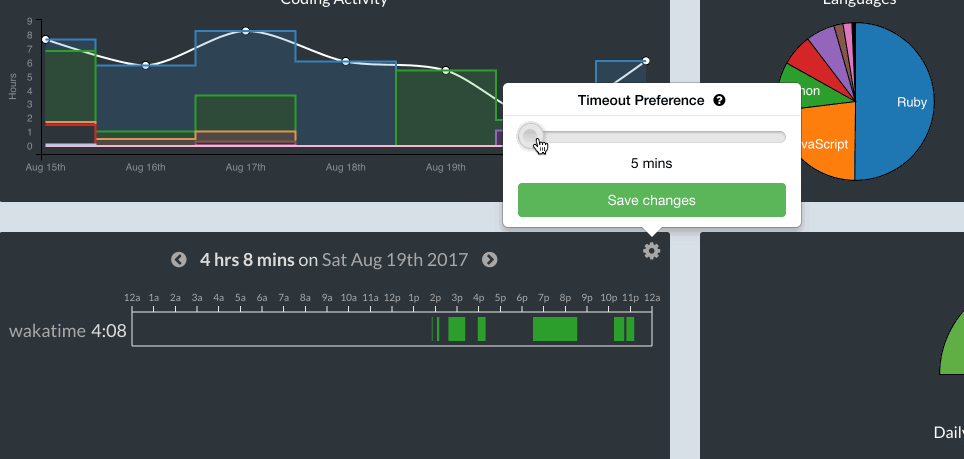
Moving the slider to the left uses a shorter timeout, for a more accurate and granular representation of your programming. Moving the slider to the right uses a larger timeout, which captures the time you spent outside your text editor.
P.S. For those of you who have been around since the beginning, you might remember a similar version of this chart from the very first version of WakaTime in 2013!