Alan Hamlett
How do you increase your productivity each day? John Carmack uses a CD player to measure his daily productivity by counting the number of tracks he listens to.
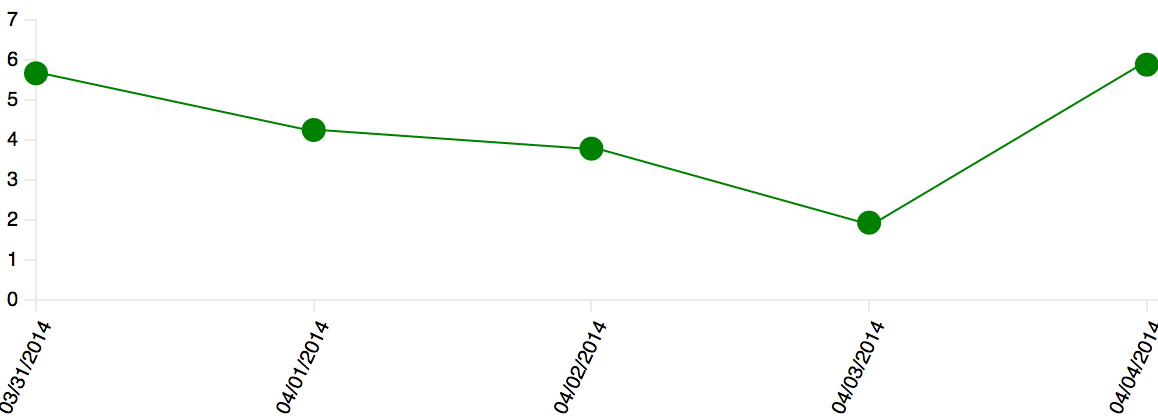
WakaTime makes it even easier by automatically logging the time you spend in your text editor each day. When you look at the time you logged over the past week, you can visually compare your productivity each day.
For example, if the line connecting today's point is trending upwards, then you are more productive today. If the line connecting today's point is trending downwards, you are less productive than the last week.
I hope you enjoy visualizing your programming with this new graph: